
Before You Start
Dataslayer lets you connect advertising, analytics, CRM and ecommerce platforms to Data Studio. You can use the imported data to create marketing reports, dashboards and automated updates without manually copying data between platforms.
Data Studio is now the current name of the platform. Some older documentation and URLs still use the name Looker Studio, so you may see both names while setting up your connector.
If you do not have a Dataslayer account yet, create one here and select Data Studio from the Destinations section.
What You Need
Before connecting Dataslayer to Data Studio, make sure you have:
- A Google account with access to Data Studio.
- A Dataslayer account with Data Studio selected as your destination.
- Access to the advertising, analytics, CRM or ecommerce platform you want to connect.
- Permission to authorize Dataslayer and access the data you want to report on.
- A clear idea of the metrics and dimensions you want to use in your report.
How to Connect Dataslayer to Data Studio
The easiest way to start is to add a Dataslayer connector from a new or existing Data Studio report.
Open a Data Studio Report
- Open Data Studio.
- Open an existing report or create a new blank report.
- Click Add data in the report editor.
Find a Dataslayer Connector
- Use the search field in the connector gallery.
- Search for Dataslayer.
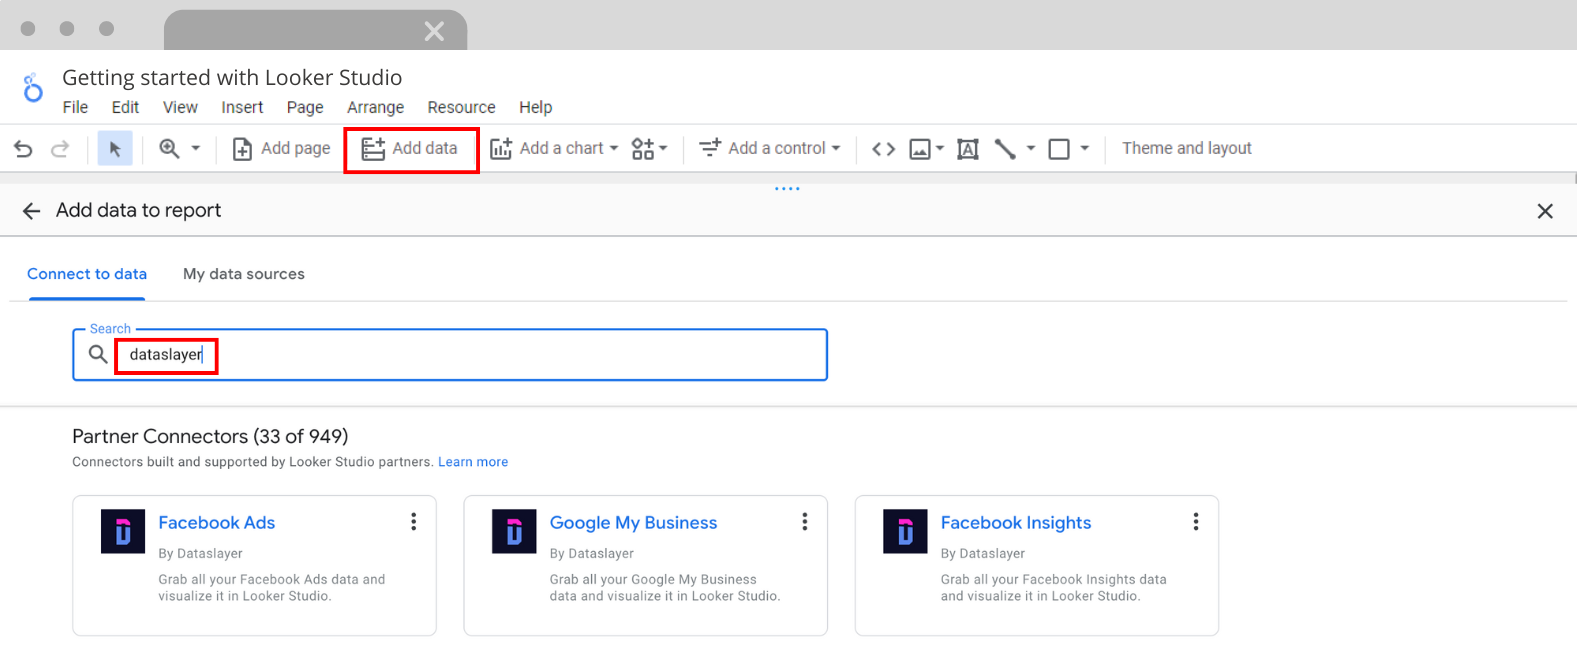
- Select the Dataslayer connector for the platform you want to analyse.
- Click Authorize or follow the connection instructions shown by Data Studio.
Dataslayer connectors are available directly inside Data Studio. You can also browse the available connectors from the Dataslayer connector gallery.
Authorize the Connector
- Click on Authorize and sign in with the account associated with your Dataslayer account in the pop-up window.
-Sep-22-2026-02-51-22-4342-PM.png?width=670&height=246&name=Browser%20template%20(4)-Sep-22-2026-02-51-22-4342-PM.png)
- Review the requested permissions.
- Accept the permissions required to access your data.
- Continue to the connector configuration screen.
If you use a different Google account in Data Studio and Dataslayer, you may see an invalid login or authorization error. Use the same account throughout the connection process.
If the connector requires you to add an account, user or hub, complete that step before selecting the data you want to analyse.
Select the Account or Property
- Select the account, property, workspace or page that contains the data you need.
- Select the accounts or account groups available under your Dataslayer plan.
- Complete the connector setup.
- Click Add to report.
-Sep-22-2026-03-20-49-9518-PM.png?width=670&height=246&name=Browser%20template%20(6)-Sep-22-2026-03-20-49-9518-PM.png)
The selected data source will now be available in your Data Studio report.
For a shorter visual walkthrough, see How to find and use Dataslayer’s connectors in Looker Studio.
How to Create Your First Data Studio Report
After adding a Dataslayer data source, you can create charts and tables from the data returned by the connector.
Choose a Chart
- Click Add a chart in the Data Studio toolbar.
- Select a chart type, such as a scorecard, table, time series or bar chart.
-Sep-22-2026-03-28-17-2633-PM.png?width=670&height=246&name=Browser%20template%20(7)-Sep-22-2026-03-28-17-2633-PM.png)
- Click the area of the report where you want to place the chart.
Start with a small number of charts. Adding too many charts to one page can increase loading time and the number of requests sent to the data source.
Choose Dimensions and Metrics
Dimensions describe how you want to group your data. Examples include date, campaign, country, platform or account.
Metrics are the values you want to measure. Examples include clicks, impressions, conversions, spend, revenue or sessions.
- Select the chart you added to the report.
- Open the chart setup panel.
- Choose the dimensions and metrics you want to display.
-Sep-22-2026-03-36-56-8507-PM.png?width=670&height=246&name=Browser%20template%20(9)-Sep-22-2026-03-36-56-8507-PM.png)
- Check that the data type and aggregation are correct.
Select a Date Range
You can define a date range for the complete report, for an individual page or for a specific chart.
- Select the chart or page.
- Open the date range settings.
- Choose a preset date range or define a custom range.
- Use a comparison date range if you want to compare performance with a previous period.
-Sep-22-2026-03-38-17-5556-PM.png?width=670&height=246&name=Browser%20template%20(10)-Sep-22-2026-03-38-17-5556-PM.png)
Add Filters and Controls
Filters limit the data displayed in a chart. Controls allow report viewers to interact with the report and change the data they see.
Common controls include drop-down lists, date range controls, input boxes and data controls. Use them when viewers need to explore the report without editing its configuration.
-Jun-06-2024-08-32-27-1084-AM.png?width=1032&height=422&name=Browser%20template%20(4)-Jun-06-2024-08-32-27-1084-AM.png)
For more information, see How to use the menu and controls in Looker Studio or How to filter, sort, and run calculations in Looker Studio.
How to Build a Data Studio Dashboard
A simple marketing dashboard normally starts with a summary of the most important KPIs and then provides more detailed views of performance.
Organize Your Dashboard
You can organize a dashboard using several pages, each focused on a different reporting question.
- Overview: main KPIs and headline results.
- Performance over time: trends by day, week or month.
- Campaign or channel performance: comparisons across campaigns, platforms or accounts.
- Detailed data: tables with the dimensions and metrics needed for analysis.
Choose the Right Charts
- Use scorecards for key totals and KPIs.
- Use time series charts to show trends over time.
- Use bar charts to compare campaigns, channels or accounts.
- Use tables when viewers need to inspect detailed values.
- Use filters and controls to keep the dashboard interactive.
For a detailed explanation of chart configuration and styling, see Understanding the charts and styling in Data Studio.
How to Use Data Studio Templates
Dataslayer templates can help you create a marketing dashboard faster by starting with a report structure that already contains charts and data sources.
Use a Dataslayer Template
- Open the Dataslayer templates gallery.
- Choose the template that matches your reporting needs.
- Click on the template.
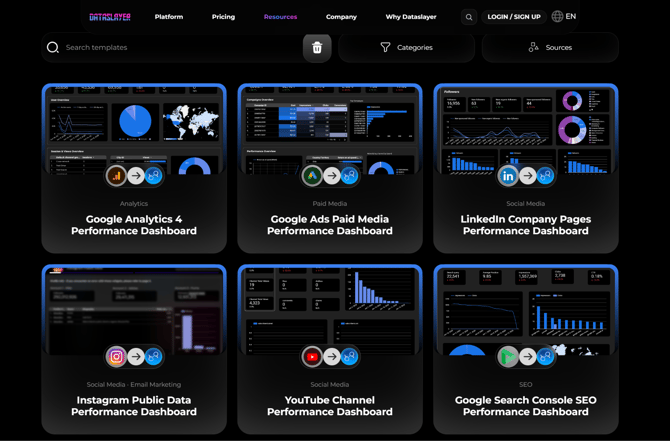
- When the template opens in Data Studio, click on the three dots and make a copy.
- Connect the required Dataslayer data sources.
- Adjust the accounts, date ranges, metrics and dimensions.
- Customize the charts and report layout.
For more information, see How to use the Data Studio templates.
How to Automate Data Studio Reports
Data Studio lets you schedule report delivery so that recipients receive updated reports automatically.
Schedule an Automated Report
- Open the Data Studio report.
- Click the arrow next to Share.
- Select Schedule delivery.
.png?width=688&height=252&name=Browser%20template%20(4).png)
- Choose the start date, delivery time and frequency.
- Add the recipients who should receive the report.
- Click Schedule.
Before scheduling a report, test the data source and confirm that the report displays the correct date range and accounts.
For detailed instructions, see How to schedule reports refresh in Data Studio.
How to Share a Data Studio Report
Use the Share button to invite specific users, share a link or schedule report delivery. Review the access settings before sharing a report that contains client or company data.
Choose the Data Credentials
Data Studio can use the owner’s credentials or the viewer’s credentials to access a data source.
- Owner’s credentials: viewers use the data connection configured by the report owner.
- Viewer’s credentials: each viewer may need to authorize the connector with their own account.
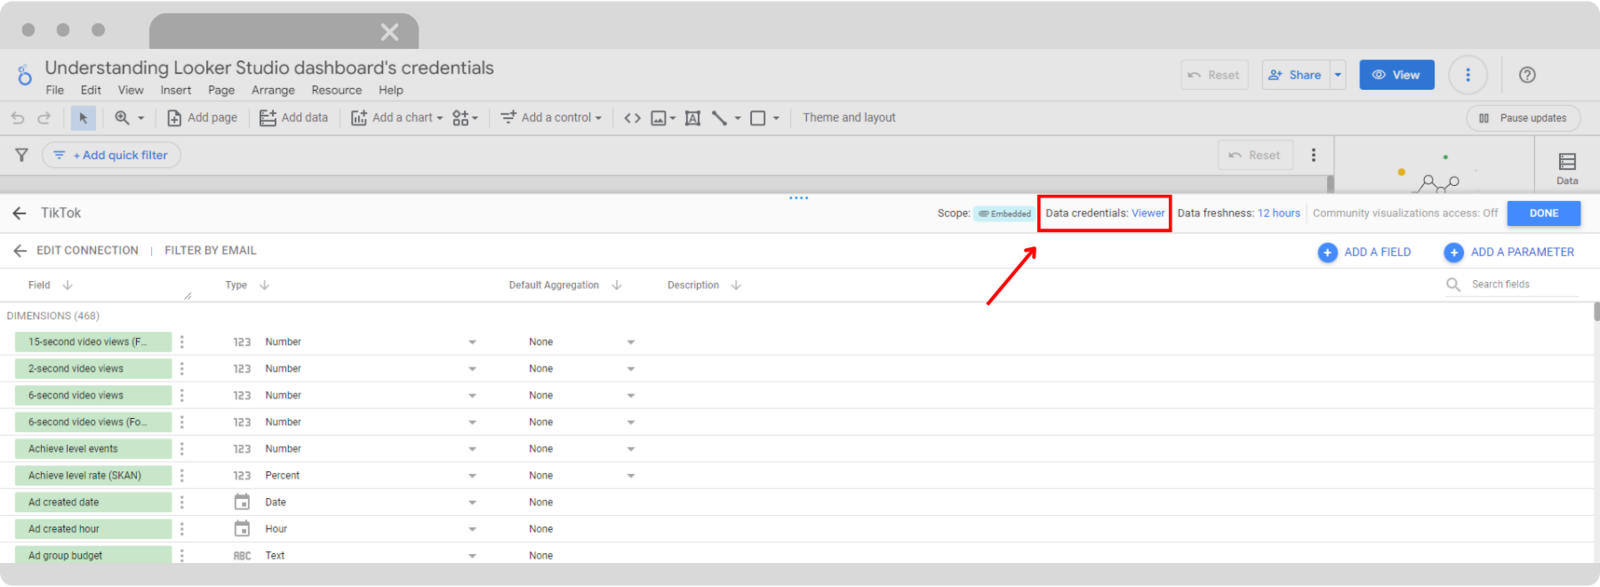
If viewers are asked to authorize the Dataslayer connector when opening a shared report, check the data credentials configured for the data source. See Understanding Data Studio dashboard credentials.
Common Data Studio Issues
The Dataslayer Connector Is Missing
Click Add data and search for Dataslayer. If the connector does not appear, confirm that you are using the correct Google account and that you have completed the Dataslayer authorization process.
Invalid Login or Authorization Error
Use the same account in Data Studio and Dataslayer. If the connection still fails, reauthenticate the connector and accept all requested permissions.
See How to reauthenticate or remove a Looker Studio connector.
Data Studio Shows a Bad Request Error
This error can appear when different Google accounts are active in the browser and in Data Studio. Sign out of unused Google accounts, use the correct account and reload the report.
A Data Source Is Missing
Open Resource → Manage added data sources and check whether the Dataslayer data source is still connected. If it is missing, add the data source again and reconnect the required accounts.
The Data Studio Dashboard Loads Slowly
Large date ranges, many charts, multiple dimensions and large data sets can increase loading time. To improve performance:
- Use a shorter date range when possible.
- Request only the metrics and dimensions you need.
- Reduce the number of charts on each page.
- Use filters and limits to reduce the amount of data processed.
- Consider using an extract or a data warehouse for very large data sets.
For more information, see Why does my dashboard in Data Studio load slowly and how can I optimize it?.
You Have Selected More Accounts Than Allowed
This message usually means that the number of selected accounts exceeds the limit available for your Dataslayer plan. Return to the connector configuration and reduce the number of selected accounts or review your plan.
Frequently Asked Questions
What Is a Data Studio Connector?
A Data Studio connector is a connection that lets a report access data from a platform. Dataslayer provides connectors for advertising, analytics, CRM, ecommerce and other marketing data sources.
Can I Connect Multiple Data Sources to Data Studio?
Yes. You can add multiple Dataslayer connectors to the same report and use them in different charts or pages. Make sure that each data source is authorized and configured correctly.
Can I Use Dataslayer with Data Studio Templates?
Yes. You can open a Dataslayer template, connect the required data sources and adjust the report to match your accounts, date ranges, metrics and dimensions.
Can I Automate Data Studio Reports?
Yes. You can schedule report delivery from the Share menu using the Schedule delivery option.
Why Can’t I See the Dataslayer Connector in Data Studio?
Search for Dataslayer from the Add data menu. If it is not available, check your Google account, Dataslayer authorization and connector permissions.
Is Data Studio the Same as Looker Studio?
Yes. Data Studio and Looker Studio refer to the same product. Data Studio is the current name, although some documentation, support articles, and certain legacy URLs still use the name Looker Studio.
Start Building Your First Data Studio Dashboard
You can now connect a Dataslayer data source, create your first chart and build a marketing dashboard in Data Studio.
For more advanced use cases, explore the Dataslayer guides for charts and styling, menus and controls, templates and troubleshooting common errors.
As always, please contact us via our live chat on our website or via email if you still have doubts or questions. We are happy to help!