Dataslayer now supports Excel as a data source, allowing our users to pull data from Excel files into different destinations like Google Sheets, BigQuery, or API Query Manager. Let's review how it can be used!
How to connect and configure the Excel Connector
1. Select Excel as a connector
To begin, select Excel as a data source in your destination interface (Google Sheets, BigQuery, etc.) and confirm the hub account you'd like to pull data from.
Remember that logging into your Hub Account is necessary to access and pull data. This guide will assist you in establishing a successful connection.
.png?width=688&height=252&name=Understanding%20Excel%20connector%20(1).png)
2. Select the Sheet to pull data
After selecting Excel as a connector and selecting the Hub Account(s), in the “Your Accounts” section, select the sheet you'd like to pull data from.
In the dropdown menu, you will see the list of all available Excel documents. Each document name appears in bold, and beneath it, you'll find a list of sheet names contained within that document. These sheet names are the actual selectable accounts you can query.
.png?width=688&height=252&name=Understanding%20Excel%20connector%20(7).png)
Please note that you can only pull data from one sheet per query.
.png?width=688&height=252&name=Understanding%20Excel%20connector%20(8).png)
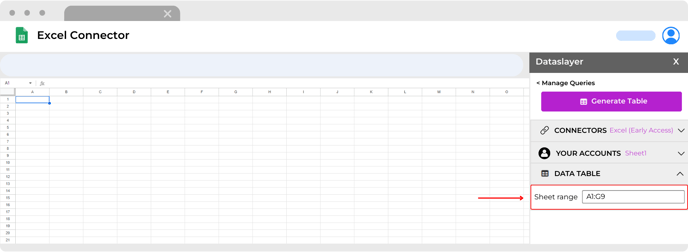
3. Define the Cell Range to extract
Once the sheet is selected, you need to configure which data range to extract.
Dataslayer supports the following range formats:
| Format Type | Example | Description |
|---|---|---|
| Empty | (leave blank) | Pulls the entire sheet |
| Single cell | A1 |
Pulls only that cell |
| Full column | A:A or A |
Pulls all data from column A |
| Cell range | A1:C10 |
Pulls data from A1 to C10 |
| Column range | A:C |
Pulls all data from columns A to C |
| Row range | 1:20 |
Pulls all data from rows 1 to 20 (across all columns) |
Keep your data clean and organized inside the Excel sheet to ensure smooth data extraction.
4. Click “Generate table” to run the query
After selecting your sheet and setting the desired cell range to be pulled, click the “Generate table” button at the top of the query configuration panel.
-
This will execute the query and load the data into your report or spreadsheet, depending on the destination you're using.


Once your data is loaded, you can also enable automatic updates by using the Schedule feature. This allows your Excel-based reports to refresh at predefined intervals without manual intervention—ideal for keeping dashboards and reporting files always up to date.
Learn more about this feature in our article: How to schedule a report refresh
And that's it, your data is now pulled from Excel!
Your Excel data is now connected and flowing into your selected platform. By selecting one sheet, configuring the range, and clicking Generate table, you can quickly extract and analyze your spreadsheet data without any manual copy-pasting.
As always, please do not hesitate to contact us via our live chat on our website or via email if you still have doubts or questions. We are happy to help!